A soil monitoring program offers the most direct means of determining the concentrations (activities), distribution, and long-term trends of radionuclides and chemicals present around nuclear facilities (DOE 1991). Soil is an integrating medium that may receive substances released to the atmosphere, particles resuspended and transported by wind, and substances in water used for irrigation. Consequently, soil contaminant data may provide information about potential pathways (e.g., soil ingestion, food ingestion, resuspension into the air, and groundwater contamination) that could deliver radioactive materials or chemicals to humans and biota.
Soils are of high interest to the WIPP-EM because aerosol releases of contaminants would eventually be deposited in surface soils, which then can serve as a source for continuing contaminant exposure and uptake via direct contact, food chain pathways, and re-suspension. From these prospectives, soils are an integrating medium of primary concern in predictive ecosystem and contaminant transport modeling that requires good information about the dispersion of analytes of concern across the landscape.
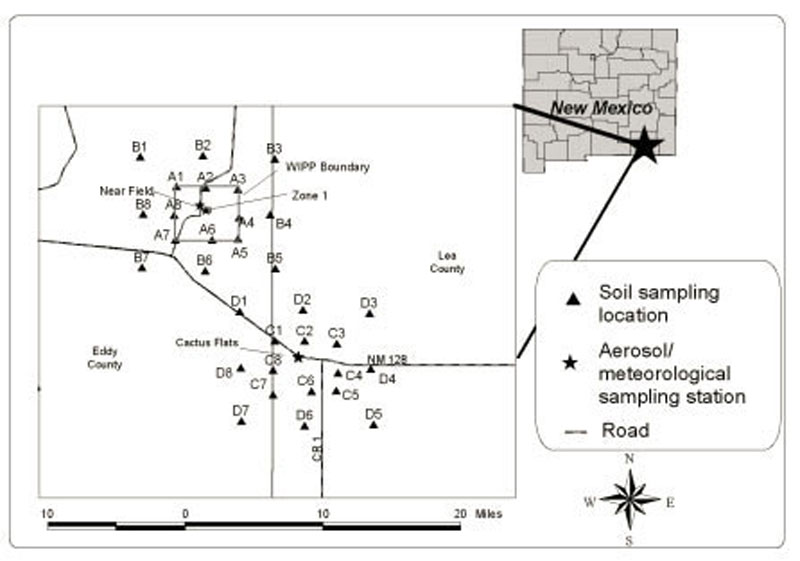
CEMRC samples soil approximately every other year and 2012 was the last year that soil sampling was performed. However with the release event at WIPP and the detection of of airborne contamination at the Near Field ambient air sampling station soil sampling was performed at the ‘A’ sampling locations (see map below).
More detailed information about the Surface Soil Monitoring program is available in CEMRC’s Annual Reports.
CEMRC Surface Soil Analysis 2014 |
|||||||||
|---|---|---|---|---|---|---|---|---|---|
 |
|||||||||
Sample analysis
|
Sample analysis
|
||||||||
SID |
Grid
|
Collection
|
241Am
|
239+240Pu
|
238Pu
|
137Cs
|
241Am
|
239+240Pu
|
238Pu
|
| 30483 | A-2 | 3-13-2014 | 0.071 | 0.158 | n/d | 1.803 | 0.071 | 0.07 | n/d |
| 30484 | A-1 | 3-13-2014 | 0.297 | 0.284 | n/d | 2.68 | 0.104 | 0.284 | n/d |
| 30485 | A-3 | 3-13-2014 | 0.076 | 0.15 | n/d | 2.649 | 0.076 | 0.15 | n/d |
| 30486 | A-4 | 3-13-2014 | n/d | n/d | n/d | 1.364 | n/d | n/d | n/d |
| 30487 | A-5 | 3-13-2014 | 0.141 | n/d | n/d | 2.791 | 0.141 | n/d | n/d |
| 30488 | A-6 | 3-13-2014 | n/d | 0.113 | n/d | 1.47 | n/d | 0.113 | n/d |
| 30489 | A-6 Duplicate | 3-13-2014 | 0.088 | n/d | n/d | 0.485 | 0.088 | n/d | n/d |
| 30490 | A-7 | 3-13-2014 | 0.086 | n/d | n/d | n/d | 0.086 | n/d | n/d |
| 30491 | A-8 | 3-13-2014 | 0.156 | n/d | n/d | 3.891 | 0.08 | n/d | n/d |
Historic Soil Maximum Activities |
|||||||||
| Near Field | All A&B Grids | 1997 | 0.11 | 0.3 | n/a | 6.38 | |||
| Near Field | All A&B Grids | 1998 | 0.07 | 0.1705 | 0.01653 | 5.053 | |||
| Near Field | All A&B Grids | 1999 | 0.049 | 0.1 | 0.045 | 3.1 | |||
| Near Field | All A&B Grids | 2000 | 0.085 | 0.14 | n/a | 3.8 | |||
| Near Field | All A&B Grids | 2001 | 0.102 | 0.389 | 0.0626 | 8.83 | |||
| Near Field | All A&B Grids | 2009 | 0.068 | 0.194 | 0.024 | 5.117 | |||
| Near Field | All A&B Grids | 2010 | 0.069 | 0.398 | 0.074 | 3.59 | |||
| Near Field | All A&B Grids | 2012 | 0.068 | 0.173 | 0.0196 | 3.66 | |||
| Gnome Site | Maximum | 2002 | 346 | 155 | 219 | 2980 | |||
| Gnome Site | Average | 2002 | 36.1 | 149 | 28.8 | 840 | |||